It happens often. Early in a project, a team member will offhandedly say something like "the site is slow," "my computer is slow," or "Docker is slow." Those all may be true. But it takes specialized knowledge to track down the root cause of performance issues. This article covers the same tips we share with our team to help solve workstation performance problems.
We'll cover mostly macOS, but the general framework is the same for any operating system. On Windows, use Task Manager instead of Activity Monitor, and on Linux, use htop or bpytop.
When a computer is slow, the best way to solve it is to:
- Identify what programs are using the most resources.
- Identify what types of resources are in contention.
- CPU: Your computer's processor. If it's at 100%, programs must wait their turn to do something.
- Memory: Where information being used by programs is stored. For example, this article is literally in memory as you view it. Your browser will keep the page in memory even after navigating away, so it's quick to come back if you hit the Back button.
- Disk: Much slower than memory, but also much bigger. And it's persistent across restarts. For example, when restarting, macOS has to load everything from the disk because memory is cleared on a restart.
- Network: The combination of Wifi and internet. If something is slow, but the three items above are all good, this is often the issue. For example, when updating ddev to a new version, the slowest part is almost always downloading it from the internet.
- GPU: Graphics processing. This mostly matters for designers and those who use graphics applications like Figma, which are 3D-accelerated.
Using Activity Monitor
Activity Monitor is useful for seeing what your computer is doing. The easiest way to open it is to open Spotlight (command-space) and search for it.
When you open Activity Monitor for the first time, you will see a window like this:
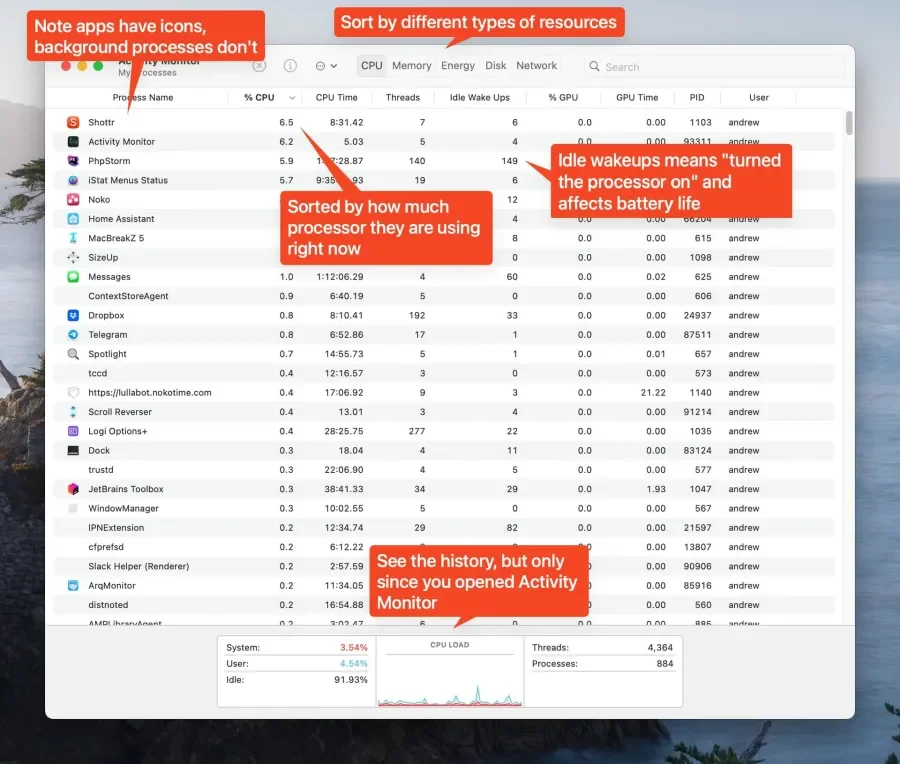
Below is the memory tab. The most important is "Memory Pressure." Once it goes yellow, you're likely to start noticing slowness.
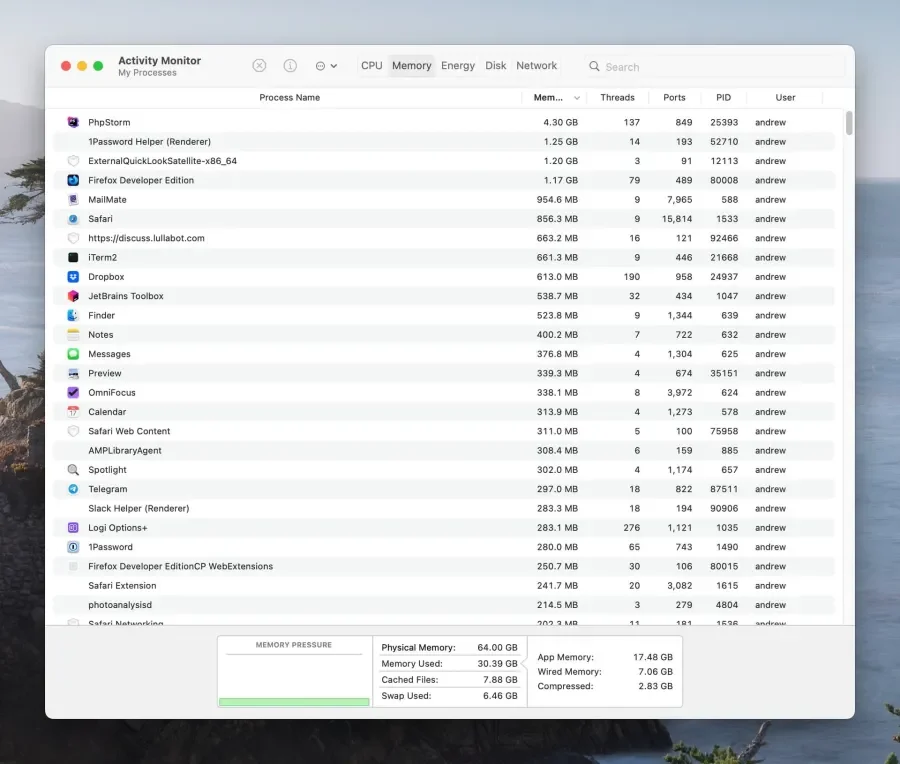
Pay attention to the "Memory Pressure"
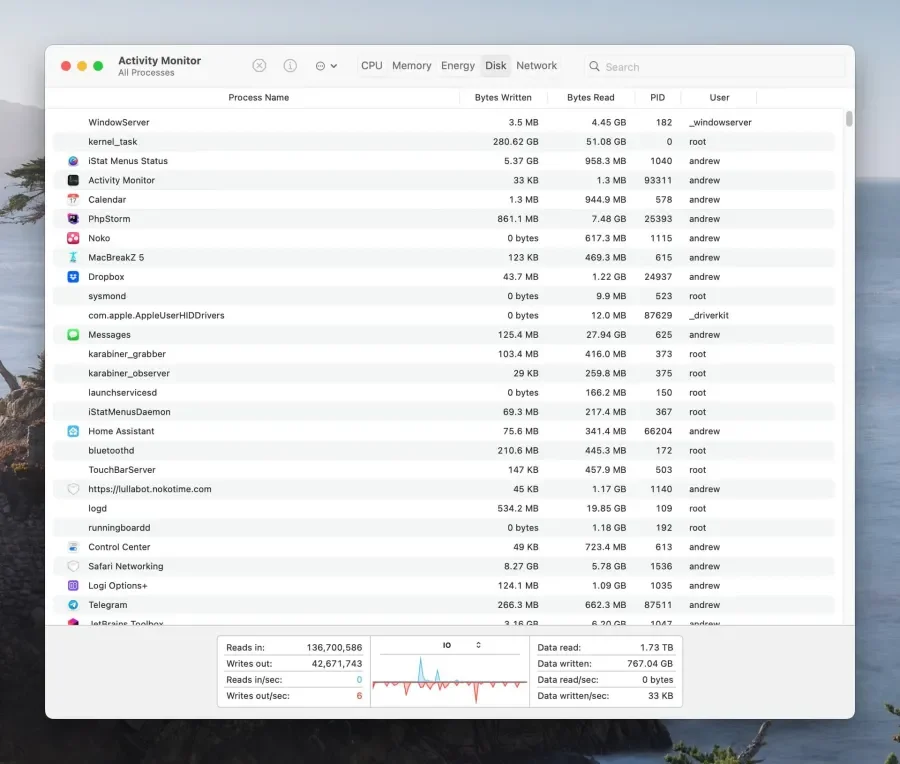
Disk is also helpful. For example, disk activity will increase significantly when pulling a new Docker image as Docker uncompresses the download.
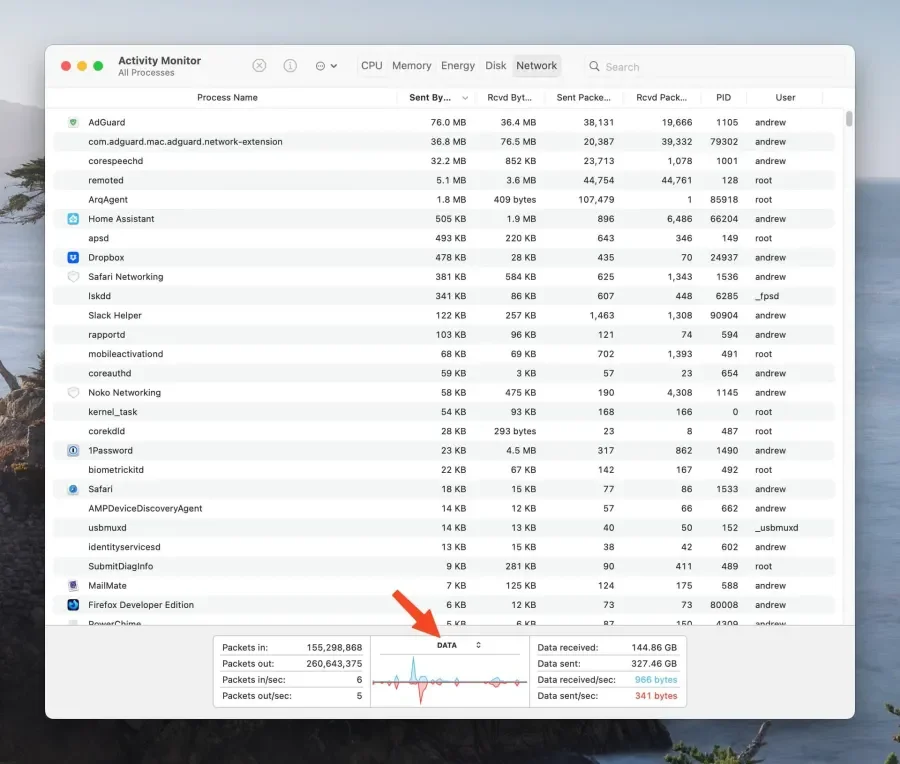
Finally, the Network tab. If you change Packets to Data, you may find this window easier to think about. You can do this at the bottom.
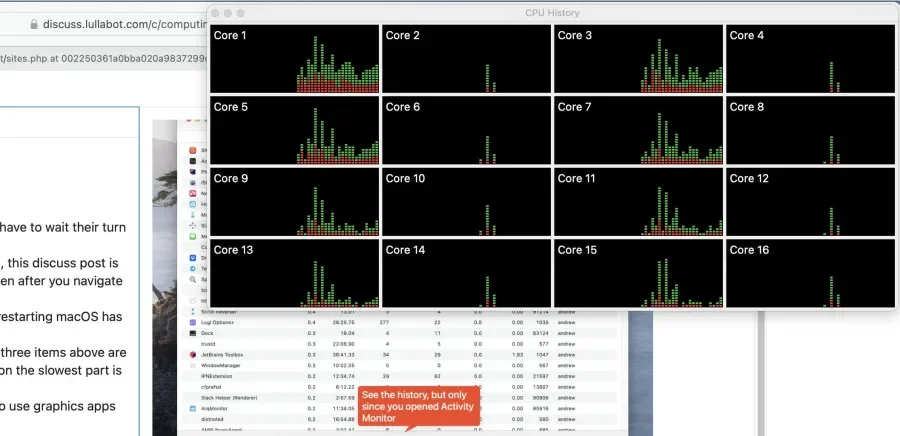
In the Window menu, there is a CPU History option. It creates a floating window with a graph for each CPU core. Use this window to see what happens when you're doing something in an application. For Intel users, this number is usually doubled. The computer this image was taken from has 8 "real" CPU cores, but the processor exposes them as 16. (You can see if your Mac uses an Intel processor by clicking the Mac icon at the top left and selecting About This Mac.)
iStat menus
We often find Activity Monitor is too busy to glance at for a quick diagnosis. When something is slow, it helps to know what's going on right now and see a quick representation of CPU, Memory, Disk, and Network all at once. iStat Menus is a go-to app for this, shipping with several useful menubar widgets.
Here's an example set of widgets from left to right:

- CPU temperature. On Intel, when this gets high (90° C+ typically), your processor makes itself slower to keep cool. Apple Silicon processors will throttle too, but it's much harder to trigger in day-to-day work.
- Network/internet.
- Disk - the lights go solid when the disk is being read (blue) or written to (red).
- Memory use.
- CPU use. The
imeans it's using integrated graphics, not dedicated graphics, which uses more battery. Apple Silicon computers only have one graphics chip and always show aD, which can be hidden.
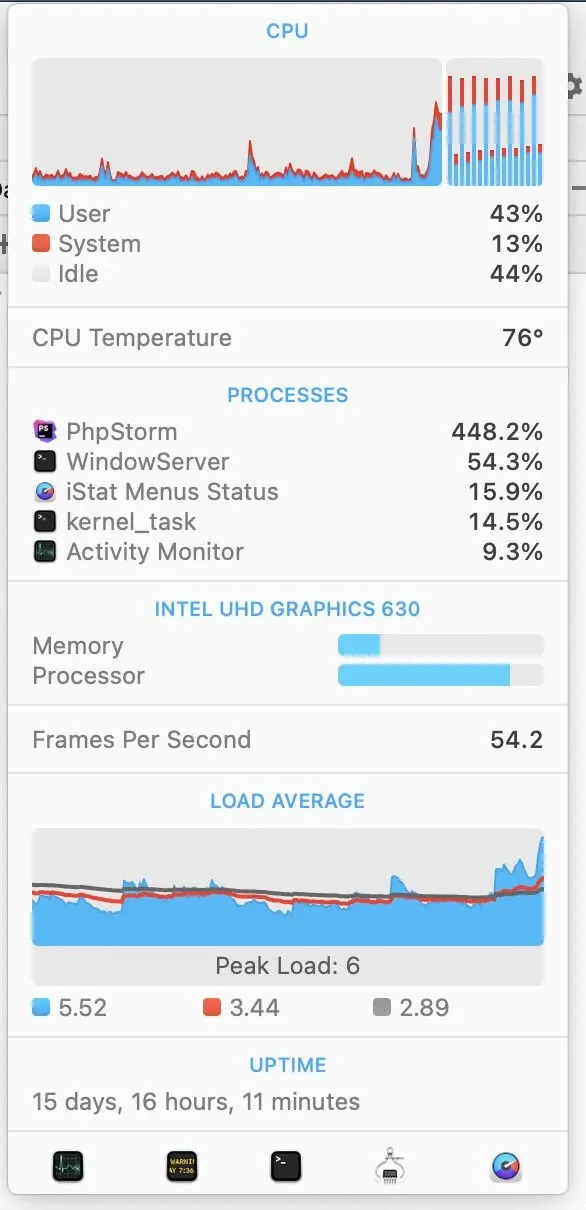
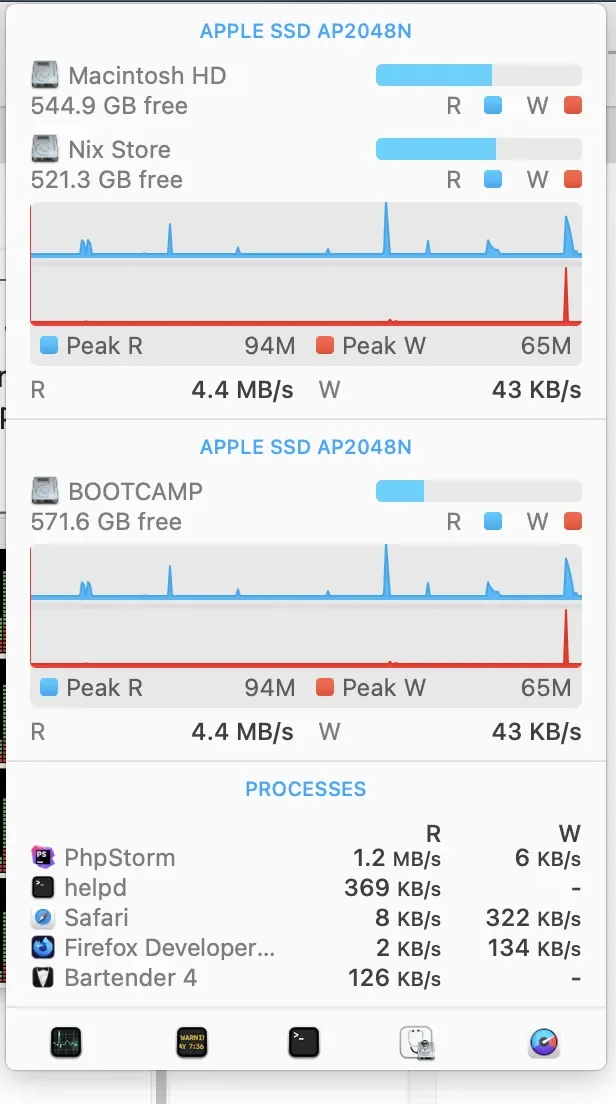
As an example, let's tell PHPStorm to "invalidate caches and restart." This will cause lots of CPU and disk activity as it reindexes the loaded Drupal project. We'll click on different sections of the iStats menubar to bring up more detailed windows.
The following two screenshots show the CPU being used, but not fully. That's because PHPStorm is waiting on the disk to read files to index.
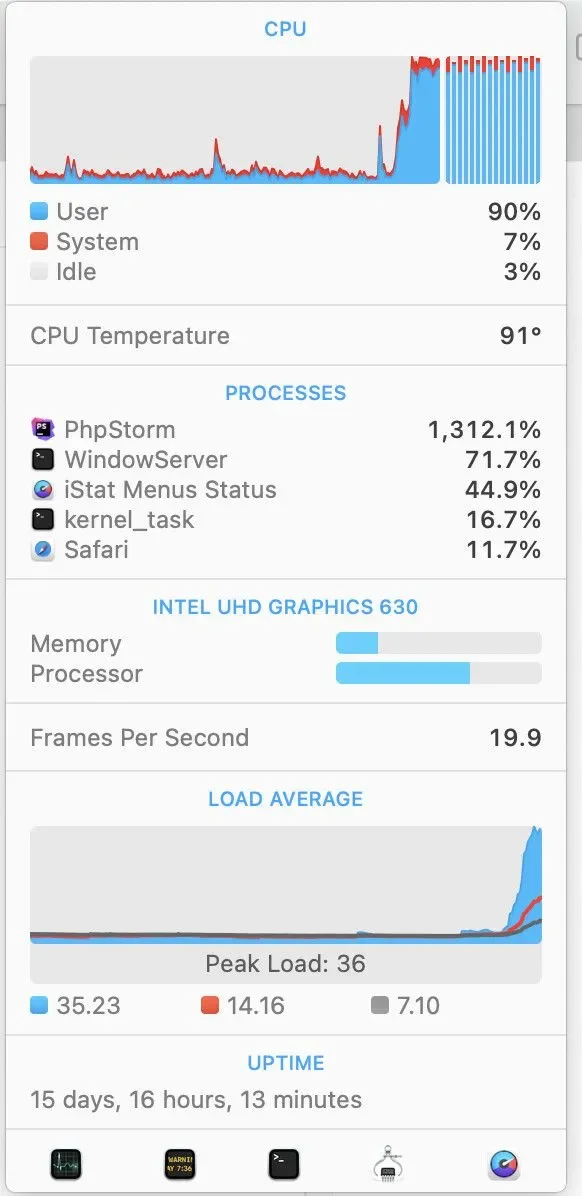
A little bit later, we can see the CPU applet nearly filling up. Even typing this article is slightly laggy.

Fixing problems
My CPU is constantly at 100%
If possible, quit the programs using the CPU you don't actively need. If you see high CPU use from a program you don't recognize, ask about it. Many macOS system programs like WindowServer (used to draw the screen) and kernel_task (used to talk to hardware) can't be quit. But, you may find that closing a browser tab with lots of visuals (like ads) reduces other processes significantly.
My memory is full
You either need to quit programs or upgrade your computer. If you see something oddly using a lot of memory, it may indicate a bug in that program.
My disk is constantly being used
Like the above, you need to quit programs you aren't currently using. Try to keep at least 10-20% of your disk free. Flash disks (SSD drives, which most computers have nowadays) need free space to operate effectively, and a disk that is 90% or more full will be significantly slower. When buying a new computer, remember that larger disks will be faster than smaller ones.
Downloads are slow, or calls are lagging
Rule out Wifi as a problem by connecting your computer directly to your router with a cable. Also, remember that your internet connection is shared with every other device in your home. If the problem is caused by other devices using your home internet connection, check if your router supports Active Queue Management. At the least, if you determine this is the issue, you know buying a new computer won't fix it.
Security scanners can often cause performance issues
Sophos, Bitdefender, and Windows Defender on Windows cause a computer to be horrifically slow, especially for developers. Our projects comprise tens of thousands of small files, the worst case for security scanners. Developers may need to find they have to exclude directories from scanning or disable third-party AV entirely.
Docker is slow on macOS
Lullabot has standardized on ddev for local environments. We recommend all macOS users globally enable mutagen for good performance. For a deep dive into why Docker is slow on macOS, see Paolo Mainardi's excellent article Docker on MacOS is slow and how to fix it. We've found that colima, ddev, and mutagen generally offer native-like performance beyond the initial code sync.
Applications on Apple Silicon are not as fast as expected
If you use Migration Assistant to migrate to a new Mac, it will copy applications over, including those written for older Intel processors. These applications will run fine but are less fast than native Apple Silicon apps. Use the "Kind" column in Activity Monitor to search for Intel apps and upgrade or replace them. Many apps, notably Electron apps like Slack, don't ship universal binaries and require downloading a new copy manually to switch architectures. Likewise, Homebrew should be reinstalled from scratch in /opt/homebrew to get native apps. Finally, Docker apps like colima may need to be reconfigured to use a native VM instead of an Intel VM.
Conclusion
We hope this guide is as helpful for you as it has been for our team. When developing websites, wasted time can mean wasted money, and a slow computer can waste a lot of time. Having an efficient local development environment ensures we provide the most value.