The web is slow, and users are taking the problem into their own hands. Surveys show that approximately 40% of users employ ad-blocking on their browsers, which eliminates the hefty performance penalty of third-party scripts. When users aren’t blocking scripts, they’re abandoning pages completely. According to Google, “53% of mobile site visits leave a page that takes longer than three seconds to load.”
Third-party scripts noticeably slow your website. According to the HTTP Archive, the median site ships with 400KB of JavaScript, which bloats to over 1MB after decompression. In 2018, the median website loaded 20 external scripts.
Byte-for-byte, JavaScript is still the most expensive resource we send to mobile phones, because it can delay interactivity in large ways.
Even if scripts do not block rendering, they add to the time to interactive metric, which leads to frustrated users when the website doesn’t respond as quickly as expected.
The value (and ease) of adding third-party scripts
Scripts tend to fall into one of three categories: advertising, analytics, and A/B testing. These scripts provide obvious business benefits. Marketing & communications departments (aka “marcom”) love to base business decisions on data analytics or A/B testing. Moreover, many websites derive their primary income from online ad sales.
Furthermore, tools like Google Tag Manager make it exceedingly easy for non-technical users to insert third-party scripts (which they call tags) and trackers into sites without regard for the performance penalty.
Death by one thousand cuts
The weight of these scripts adds up. It rarely is one script that kills performance, but rather “death by a thousand cuts,” where the sum of all of the JavaScript dramatically slows down your site. JavaScript that calls more JavaScript that calls more JavaScript can quickly turn your site into the author’s worst nightmare.
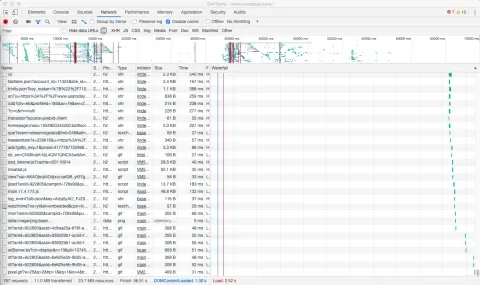
Screenshot of Chrome Developer Tools’ network tab profiling usatoday.com showing 767 HTTP requests and over 11MB data transferred (March 2019)
Slow websites affect the bottom line
Study after study proves slow websites hurt conversions. The ones listed below are from Jeremy Wagner’s recent Why Performance Matters article on Google’s Web Fundamentals microsite. They all shout the same message: slowing down your website has a direct and measurable effect on the revenue that it generates.
- The BBC found they lost an additional 10% of users for every additional second their site took to load.
- DoubleClick by Google found 53% of mobile site visits were abandoned if a page took longer than 3 seconds to load.
- Pinterest increased search engine traffic and sign-ups by 15% when they reduced perceived wait times by 40%.
- COOK increased conversions by 7%, decreased bounce rates by 7%, and increased pages per session by 10% when they reduced average page load time by 850 milliseconds.
- For Mobify, every 100ms decrease in homepage load speed worked out to a 1.11% increase in session-based conversion, yielding an average annual revenue increase of nearly $380,000.
Measuring the performance impact of third-party scripts
It’s easy to give performance studies to marketers and have them agree that it’s good to have a fast website. It’s a completely different task to convince them that their “tags” are to blame.
In these tutorials, I’ll walk you through two methods of assessing the direct performance impact of third-party scripts. The goal is to accurately measure the performance of the webpage with and without third-party scripts. The same techniques can be used to drill down and isolate the performance of specific products and scripts. The results can then be used to evaluate if the various scripts are worth their performance penalty.
Generating comparison loading videos with WebPageTest.org
WebPageTest.org is a free, open source project that lets you evaluate your website from a performance standpoint. It generates waterfall views of resource loading, captures videos of the webpage rendering, and lots more. Crucially, you can compare two performance profiles, and easily see the difference between them.
In this tutorial, we’ll run two tests against my hometown newspaper’s website, Gainesville.com. We’ll run one normal and one without third-party scripts. Then we’ll generate a comparison video that will compare both scenarios side-by-side.
The steps in the video above limit the requests to three domains (delimited by spaces). These are necessary because they contain the required resources for the site to render. Note you can use the blockDomains keyword here to disallow only specific domains.
blockDomainsExcept www.gainesville.com cdn.gatehousemedia.com cdnjs.cloudflare.com
navigate  https://www.gainesville.com
WebPageTest does much more than this. The site allows the user to block only certain scripts or types of scripts, allowing us to isolate the performance profile for specific products. For more information, see Andy Davies’ blog post, Measuring the Impact of 3rd-Party Tags With WebPageTest.
Timing third-party scripts with Chrome Developer Tools
It’s also possible to measure a third-party script's performance penalty using Google Chrome’s developer tools. Unfortunately, it doesn’t generate the before and after comparison that WebPageTest.org can provide.
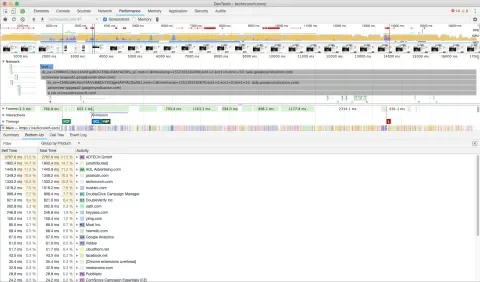
Bottom-up performance profile of techcrunch.com third-party scripts generated from Google Developer Tools.
- Navigate to your website. It’s best to do this in a “guest window” so the performance profile isn’t being changed by browser plugins (such as any ad-blockers that you might be running).
- Open up Developer Tools, and navigate to the “Performance” tab.
- Click the “Reload” button in the upper left corner. This will reload the page while recording a performance profile.
- It will take anywhere from 5-30 seconds for the profile to complete. Once it is complete, navigate to the “Bottom Up” tab on the bottom “drawer.”
- Select the option to “Group by Product.” This will isolate various scripting/layout/etc operations by product.
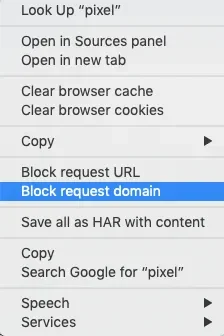
Note you can also block specific URLs and domains within DevTools by navigating to the “Network” tab, right-clicking on a request, and selecting “Block request URL” or “Block request domain.”
Discussions with marcom
This data clearly isolates the third-party scripts dogging site performance in a way that’s comprehensible to non-technical stakeholders. Once the data is in hand, the question needs to be asked,
This tag adds 0.5s to the page load. We estimate this reduces revenue by 7%. Does it increase revenue by more than that?
Bringing visibility to performance is important. Various services have optimization settings that can greatly affect the performance and size of the script even if it is still enabled. Most importantly, conversations like this communicate the importance of web performance to the entire team.
A culture of performance
Both developer tools and WebPageTest.org integrate well into continuous integration pipelines. In addition, numerous services (such as SpeedCurve and mPulse) exist that continuously monitor site performance using “Real User Monitoring” and can trigger alerts if performance crosses a certain threshold.
Bringing visibility to external script performance is crucial when bringing about a culture of performance. Performance is a team effort — this includes marketing and communications.
Performance is about people, not metrics.
It takes effort to demonstrate the effects of adding scripts to non-technical people, but the result can be well worth it. WebPageTest.org and Chrome Developer Tools can help drive through the message by making the data easily understandable and relatable.