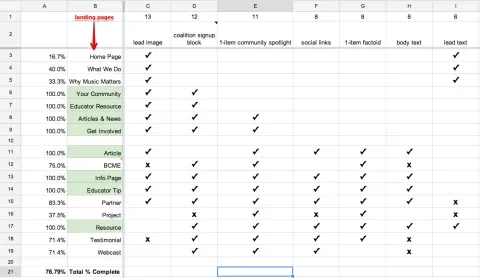
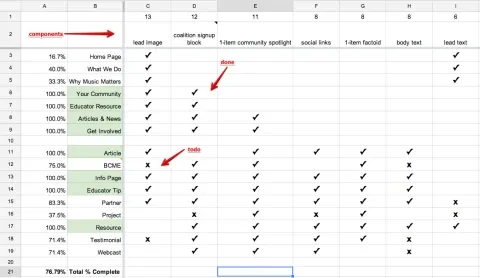
Breaking down a digital project into bite-sized pieces is often a challenge, because there are so many ways to do it. User stories, functional silos, and more can all be useful. Recently, we've also used what we call a "Development Matrix" — an inventory of a website's visible, visitor-facing components. What landing pages, common template pages, and index pages must be built? What components (blocks, images, videos, text) show up on those pages?
Having this inventory of pages and components in a spreadsheet gives us a clear picture of every element that needs to be accounted for in the finished site, and allows us to track the completion of those pieces more accurately. We can calculate the project's visible progress, and it can even help us prioritize architectural work. If a particular component appears on more pages than another, then it's going to have a bigger impact on our bottom line.
Landing Pages
In our matrix, we use this term to cover any visitor-accessible location on the web site. Typically you'll have mockups of each of these pages, because it's how designers typically think about the site. The home page, an individual article, or a listing of articles in a particular category are common examples. Start by identifying all of these and listing them in your spreadsheet in the second column. The first column will be used for some calculations that we'll get into later.
As you work through these landing pages, some templates might be the same, or have the exact same components. For instance, if you have a listing page of articles (listing A) and a listing page of people (listing B) and they use the same mix of components (such as the same sidebar blocks and then the main listing itself), they'll probably be implemented using the same underlying templates. When a block is placed on one, it will show up on the other. This constitutes the same body of work and should be tracked as such. In these situations, you might want to consolidate listing A and listing B into the same line item. A good general rule is to think of the work being done, and if it's accomplished with one ticket, it's probably okay to consolidate it in the matrix.
Web Components
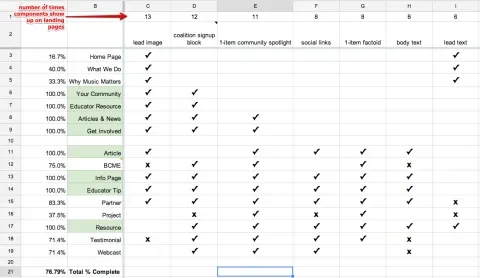
These are the various elements on the landing pages. Is there a title; a sidebar block for listing related articles; a newsletter signup widget at the bottom? List these in the subsequent columns on the second row. The first row will be used for calculating the amount of times any one component appears across the site.
At this point it's a good idea to come up with standard names for your components, perhaps based on the visible title of the component if it has one. Insert a note or comment in it's cell that links to either the actual ticket for building out the component, or to a screenshot of the component. This helps immensely in situations where terminology or descriptions are ambiguous, such as "Article listing A" and "Article listing B".
As you list a new component, cross reference which landing page/s it appears on and place an "x" in the corresponding cell at which the landing page and component intersect. You'll soon have a full inventory of x's in various cells — and then, you can begin to use the data.
Calculations
The first calculation is a pretty straight-forward one. The top row is used for a simple COUNTA() which returns the number of x's in a given column. This just gives you a quick way to you see what components are more important, or at the very least, how many line items can be crossed off by finishing a single component. It can also help with prioritization. You might be able to hold off working on a component that shows up in just one place on one landing page, while front-loading work on a component that shows up on every single page.
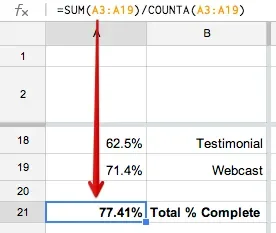
The second calculation is a bit trickier. Google Spreadsheets has a neat little function called COUNTIF(). This returns a conditional count across a range, which means it can return the number of times a certain character appears. For our purposes, I set this to COUNTIF([range], "✓") in order to count the number of check marks. I then divide that by the COUNTA([range]) (the number of cells that have something in them) and format the cell as a percentage. The complete calculation is something like =COUNTIF(C5:AV5, "✓")/COUNTA(C5:AV5): the completion percentage of each page, based on the underlying components it's built with.
How it helps
This simple tool has helped our team and our clients visualize what needs to be done and how far we've progressed. It doesn't account for the level of effort, or any of the backend work that needs to be done to make the site work, but it does represent how complete we are from the perspective of most clients and stakeholders.
If you'd like to use this technique on your projects, we've made a template on Google Docs. If you use it, or have ideas to change it, I'd love to hear them in the comments!


