Using a PHP Debugger is a great way to effectively debug your code. A debugger gives you the ability to trace your code line-by-line, with the call stack and all the variables available for inspection at run-time. In previous versions of Mac OS X, installing Xdebug could be a hassle. The recently release Mountain Lion version makes it easy by shipping with many of the tools we need for PHP debugging.
Setting up Xdebug
OSX Mountain Lion conveniently ships with Xdebug. If you're using the earlier OSX Lion version, you can download and install Xdebug with PECL (PHP Extension Community Library) or Homebrew. Once you have Xdebug installed, we need to make it available to PHP by editing the php.ini file. To do that, open up /etc/php.ini with your text editor.
If /etc/php.ini doesn't exist, create a copy of the default file with the following command:
sudo cp /etc/php.ini.default /etc/php.ini
Then find and uncomment the following lines in /etc/php.ini
zend_extension="/usr/lib/php/extensions/no-debug-non-zts-20090626/xdebug.so"
xdebug.remote_enable=1
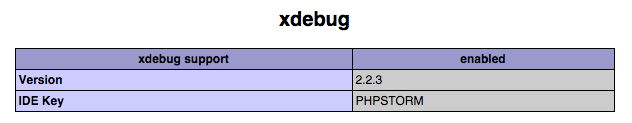
Restart Apache, then make sure Xdebug is loading by looking at phpinfo.
<?php phpinfo(); ?>
IDE
Finally, we have to tell the IDE how to communicate with Xdebug. In this example, I'm using PhpStorm but you can use any compatible IDE. Start by setting up a new project. Once you have it set up, we will set up the debugger here.
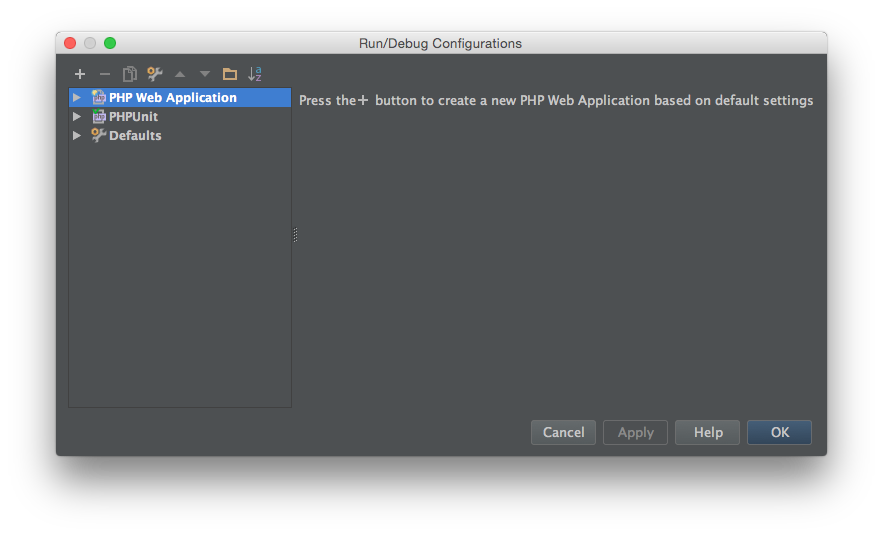
First, add a new PHP Web Application
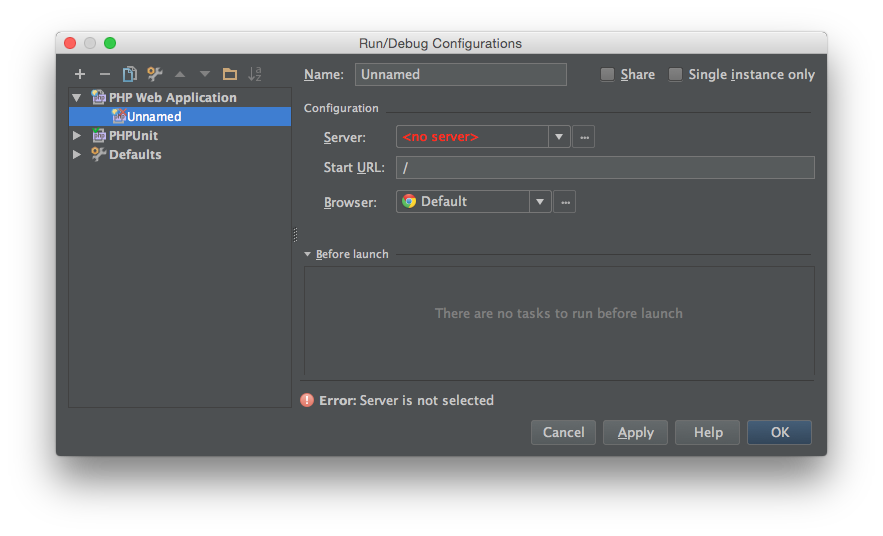
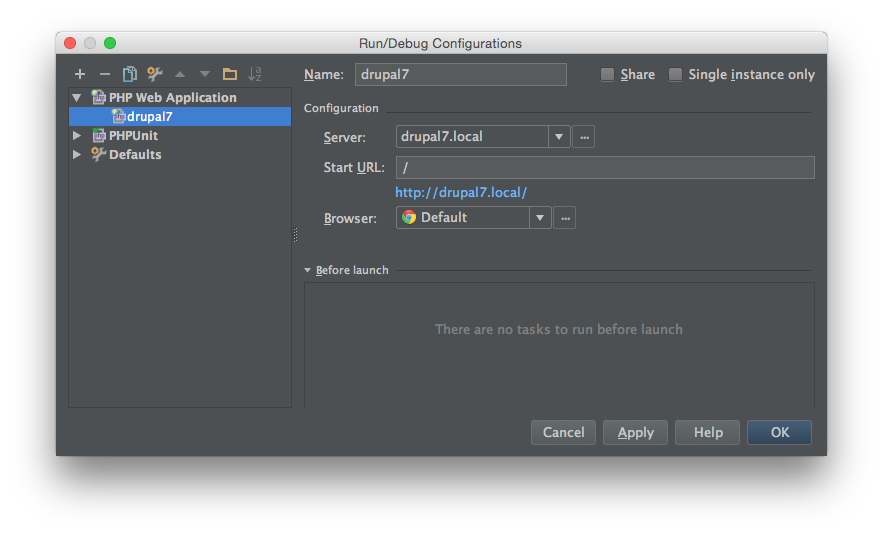
Add a new server, your Host will be different depending on your setup
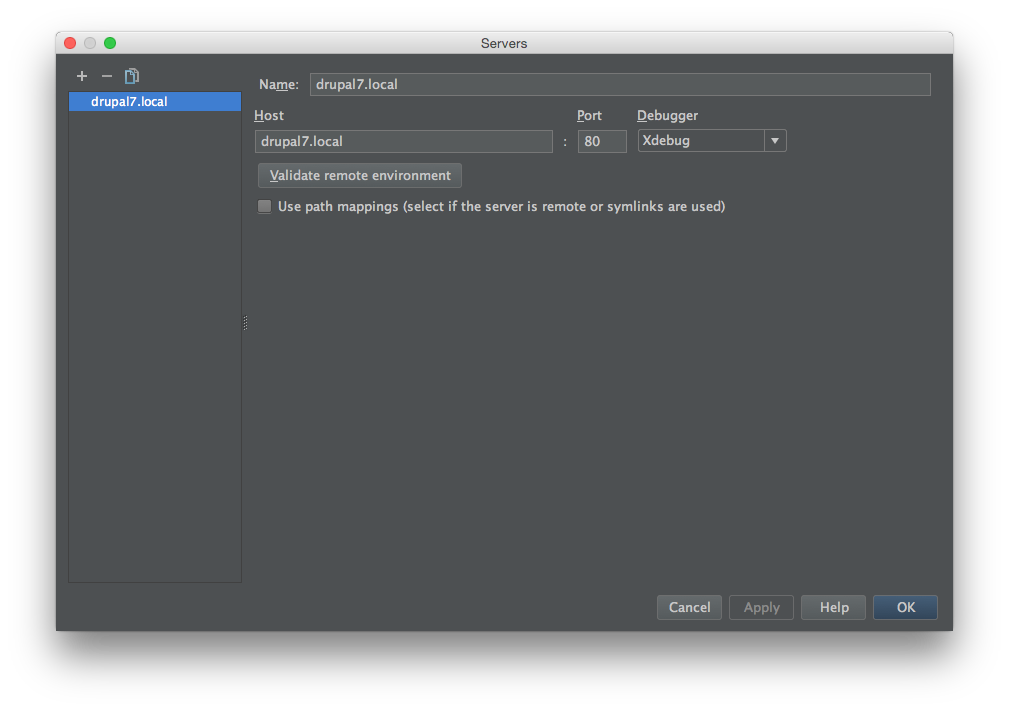
Your configuration should look something like this, where http://drupal7.local/ is where your drupal instance is
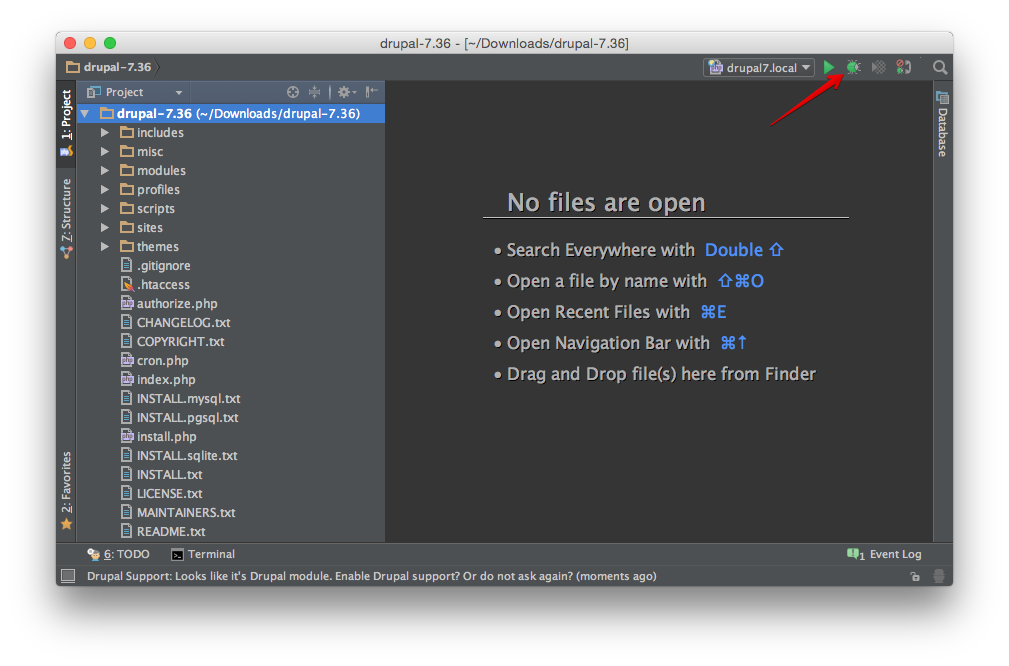
Now we can run the Debugger
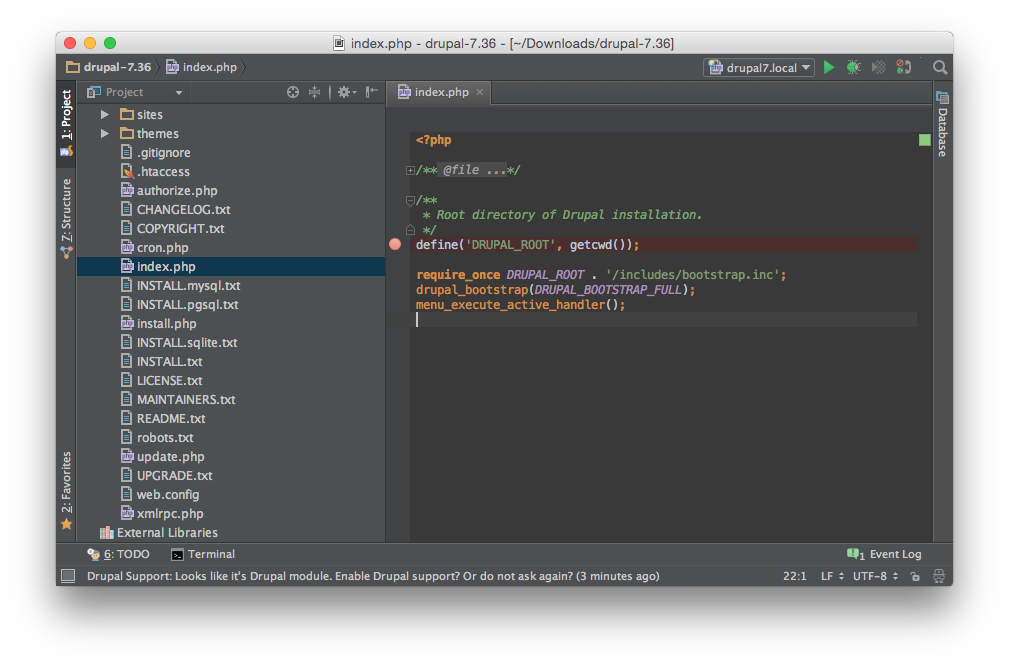
The browser should now open up http://drupal7.local?XDEBUG_SESSION_START=xxxxx and the debugger should open up in Phpstorm. To make sure the debugger is working properly, let's set a break point in index.php.
Refresh the browser and the debugger should invoke and stop at the break point.
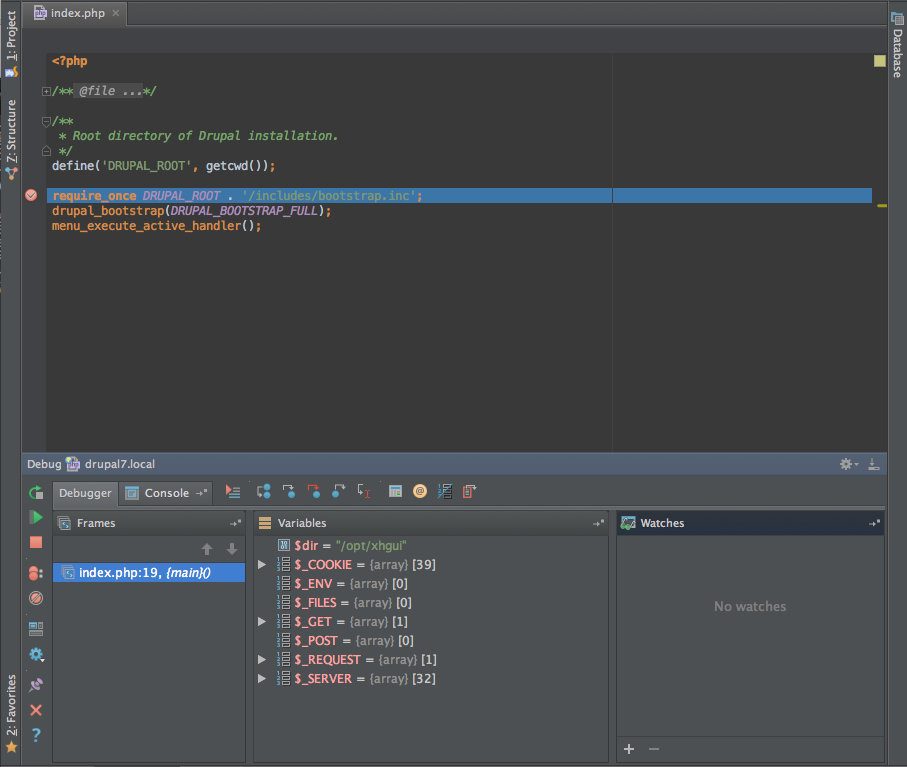
We're now ready for some PHP debugging!