

After launching GovHub, the shared platform powering more than 75 state agency websites, Georgia wanted to make the platform's performance just as visible as the services it delivers. The existing analytics site published a limited set of Google Analytics data for georgia.gov, leaving agency teams without a public view of how their own websites were performing and providing no statewide picture of GovHub.
We partnered with Digital Services Georgia (DSGa) to build analytics.georgia.gov, a public dashboard that brings together performance data from across the platform, giving agency teams, residents, and legislators an easy way to understand how Georgia's digital services are performing.
Key outcomes
- One public dashboard for 75+ state agency websites
- A statewide view of digital performance
- Actionable insights for every agency
- Greater transparency across state government
- Built to scale as Georgia’s platform grows
- Automated reporting with minimal maintenance
A dashboard that people can actually read
The site is organized around four kinds of pages:
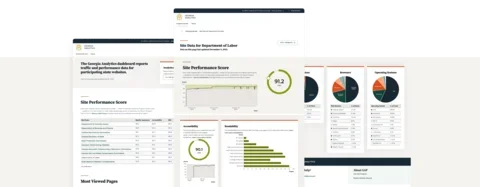
- A statewide home page showing platform-wide performance
- An index of every agency on GovHub
- Individual pages for each agency site
- Plain-language documentation explaining metrics and data sources
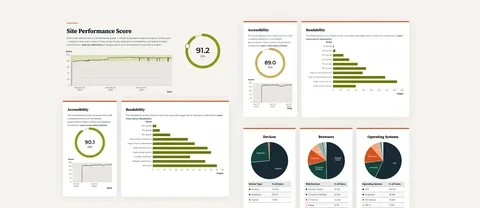
Agency teams can compare their site’s performance against statewide benchmarks, while residents and oversight groups can quickly understand how the state is doing overall.
To support both audiences, we designed a small set of reusable components for traffic trends, accessibility scores, content quality, and page-level detail that adapt to different datasets across the site.
Coordinating the front and back end
The dashboard uses Orchard, the design system we created for GovHub, providing accessible, reusable components from the start and allowing development to begin directly from wireframes.
Because the chart components and data pipeline had to be built at the same time, we defined a shared JSON format before development began. That let front-end work proceed using realistic sample data while the Siteimprove integration was still under construction. This enabled agency and statewide pages to share the same components without a translation layer between them.
Turning site-level data into statewide insights
Siteimprove reports on one site at a time, but Georgia needed platform-wide metrics.
We built an automated process that performs roughly 700 API requests across all GovHub sites, stores the results, and aggregates them into statewide and agency-level datasets. Static pages are generated from this stored data, ensuring fast page loads without waiting on live API requests.
We started with a prototype phase to validate data retrieval, storage, and aggregation before committing to the full build. Once we knew the architecture would scale, we built an automated pipeline that collects, stores, and processes the data. The site is generated from those stored results, so pages load quickly without waiting on live API calls.
Built to run without a caretaker
DSGa wanted a solution that would operate with little ongoing maintenance. Data collection runs on a schedule in AWS. The site rebuilds only when the platform changes, such as when a new agency site launches. CloudFront handles caching and HTTPS. The same CI pipeline that deploys GovHub also handles the dashboard.
The result is a scalable, self-maintaining public record that gives Georgia a transparent, continuously updated view of digital performance across state government.
Services
We provided the following kinds of services to help this project succeed.
-
Front-end Development
-
UX & Design